 |
 |
|||||||||||
|
|
|||||||||||
|
Letter serial correlation (LSC) in additional languages and various types of texts1. Experimental dataBy Mark PerakhPosted on October 20, 2009
1. IntroductionThis paper could not be written without the contribution by Dr. Brendan McKay who not only was the first to suggest the idea of the Letter Serial Correlation test, but also developed the computer program for measuring the Letter Serial Correlation sums, conducted the measurements and critically discussed with me all aspects of this research. Of course, I am alone responsible for any weaknesses and possible errors in this paper. The Letter Serial Correlation (LSC) effect was described in detail in the previous publications [1] where its definition was given as well as the computational and measurement procedures were laid out, and also the results of the study of that effect in some Hebrew, Aramaic, Russian, and English texts were reported. While the study reported in [1] encompassed many aspects of the LSC effect, and included its analysis from various standpoints, only four languages were subjected to the tests, leaving open the question whether or not there may be some undiscovered peculiarities of LSC in languages other than the four ones listed above. Moreover, the variations, among languages, in the characteristic quantities inherent in LSC, could not be put into some systematic order because of the limited number of languages tested. In this paper the results of further studies of the Lettter Serial Correlation (LSC) effect are reported, which were conducted for eight additional languages as well as for various types of texts, including texts obtained by various methods of permutation of a meaningful original text, and also artificially created texts with deliberately designed structures. Finally, the LSC test had been applied to the Voynich manuscript [2]. This, 1st part of the paper contains the report on the experimental data, while part 2 of this paper is devoted to the discussion of those data. Since both parts 1 and 2 constitute essentially one paper, the sections, graphs, and tables are numbered consecutively throughout parts 1 and 2. To facilitate the navigation through both parts of the paper, hyperlinks are inserted where appropriate. Understanding the following sections requires familiarity with the Letter Serial Correlation as it has been described in [1]. 2. LSC in various Hebrew Biblical textsBefore discussing LSC in additional languages and various types of texts, let us view the results of LSC measurements in 13 Biblical Hebrew texts. These measurements were conducted, first, to verify that LSC in texts other than those tested before has similar (or possibly distinctive) features, and second, to find more precisely the location of the Primary Minimum Point (PMP). Most of the measurements in [1] were performed for certain discrete values of chunk's size n. For the Hebrew texts tested in [1] the location of PMP was invariably found at n=20. The only exception was the Samaritan Genesis where PMP was located at n=30. The measurements in [1] were made at n=10, n=20, and n=30, but not at any intermediate values of n between 20 and 30. It was hypothesized in [1] that the actual location of PMP in all Hebrew and Aramaic texts was somewhere between 20 and 30, and moreover that the location of PMP is somehow connected to the number of letters in particular alphabets. For example, the Hebrew alphabet consists of >z=22 letters, and the location of PMP seemed to happen close to n=z. To find the precise location of PMP, LSC sums in 12 additional Biblical Hebrew texts have been measured, these texts listed in Table 1. In these measurements, the LSC sum was found for a number of interim values of chunk's size n between n=20 and n=30. In Table 1, the locations of PMP are shown for these 12 additional texts plus Genesis, for which we have previously [1] measured LSC sums and found the PMP to be, roughly, at n=20. In Table 1 also the lengths of all 13 texts (expressed in the number of letters) are indicated. The abbreviations in Table 1 are as follows: DCP means Downcross Point; PMP means PrimaryMinimum Point; and UCP means Upcross Point, as these characteristic points had been defined in [1]. Table 1 Characteristic points of LSC in 13 Biblical Hebrew texts
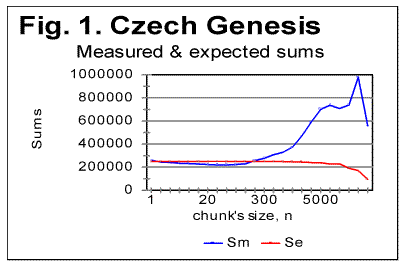
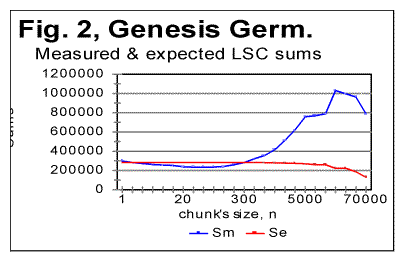
As can be seen in Table 1, the PMP in all 13 Hebrew texts were indeed found at or near n=z=22. In seven texts PMP was found exactly at n=22, while in two texts it was at n=21, in three texts at n=23, and in one text at n=24. The data for Downcross Points (DCP) and Upcross Points (UCP) listed in Table 1 are similar to the results discussed in [1] for the four languages studied there. 3. LSC tests for Genesis in various languagesTo exclude the effect of various texts' contents, i.e. to reveal the effect of the language itself, the test was conducted on the same text, namely on the translations of the Book of Genesis into the following languages: Czech, Finnish, German, Greek, Italian, Latin, and Spanish. Additionally, a text in Yiddish was tested , which was a compilation of several short tales, since no Yiddish translation of the Book of Genesis seemed to be available. The text in Yiddish was transliterated, for the test, into Latin characters. For all languages explored, both the full version of the text, and its version stripped of vowels were studied. Additionally, in the cases of the Italian and Finnish translations of Genesis, versions stripped of all consonants were also tested, for the reasons explained in a later section of this paper. Finally, for the reasons also explained further in this paper, also a version of the text of the Book of Isaiah in Italian, which was stripped of all vowels, was tested. The Czech, German, Greek, Latin and Spanish texts of Genesis, both the all-letters and no-vowels versions, as well as the Yiddish short tales text, and also the Italian text of Genesis in all-letters and in no-consonants versions (but not in the no-vowels version, see below) all displayed the typical behavior of the LSC effect quite similar to that observed earlier for Hebrew, Aramaic, English, and Russian texts. As an illustration, Figs. 1 and 2 show the curves of the measured and expected LSC sums [1] for the Book of Genesis in Czech and German. Similar graphs were obtained for Greek, Latin and Spanish, and also for all-letters and no-consonants version of the Italian texts, as well as for the Yiddish text of short tales.
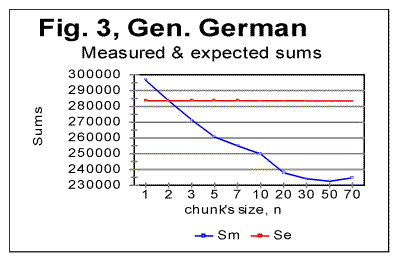
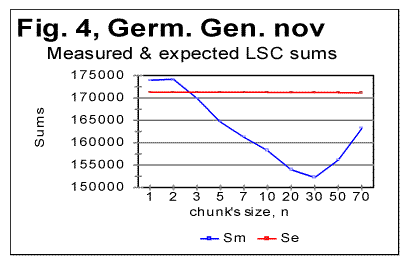
Stripping the texts of Genesis in Czech, German, Greek, Latin, and Spanish, of vowels, resulted in a shift of the Downcross Point, Primary Minimum Points and of the Upcross Point [1] in the same way it was observed for English and Russian texts in [1]. As an illustration, Fig. 3 and 4 show zoomed-in graphs of LSC sums for the German text of Genesis, both the all-letters version and the one stripped of vowels.
As can be seen from these graphs, the Downcross Point, which in the German text of Genesis is between n=2 and n=3 in the all-letters version, shifts in the no-vowels version to be between n=1 and n=2. The Primary Minimum Point, which in the all-letters German text is at n=50, in the no-vowels version shifts to n=30. Analogous behavior was observed also in Greek, Latin, Czech, and Spanish texts. However, Italian text stripped of vowels, as well as all three versions of Finnish text, displayed a different behavior which will be described and discussed separately. In Table 2 the values of chunk’s size n, corresponding to the characteristic points on LSC sum's curves, are gathered. For comparison, this table also includes the data for the Hebrew and English texts of Genesis, obtained earlier [1], as well as the data for the Yiddish short stories text. Notations used in Table 2 are as follows: DCP - Downcross Point's location on n-axis. PMP - Primary Minimum Point's location, and UCP - Upcross Point's location. Table 2. Characteristic features of LSC sum curves
A discussion of the data given in Table 2 will be offered in Part 2 of this paper. 4. Peculiarities of LSC effect in Finnish and some Italian textsWhile the behavior of LSC sums in all the
texts referred to until now, including all-letters, no-vowels and
no-consonants versions, was observed to be qualitatively identical, differing
only in some quantitative characteristics, the first sign that some texts may
behave "abnormally" appeared when the text of Genesis in Italian
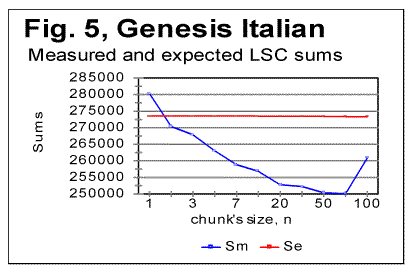
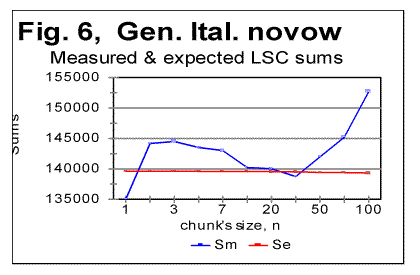
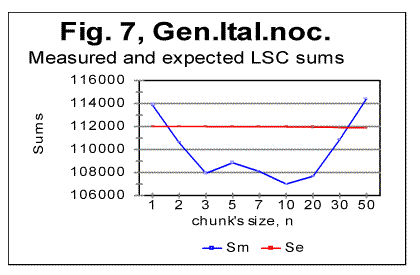
translation was tested. Fig. 5 shows the LSC sums for the all-letters
Italian Genesis, while Fig. 6 shows it for the no-vowels version, and Fig. 7,
for the no-consonants version. In all three graphs, only the initial part
of the range of chunk's size n is shown, since only in that part of the range the
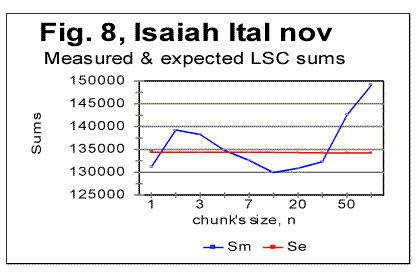
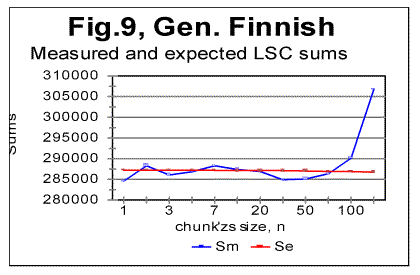
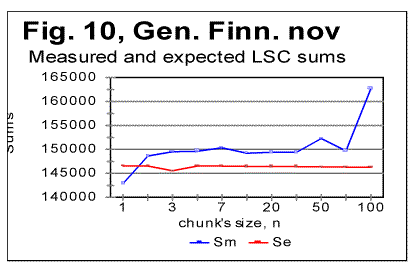
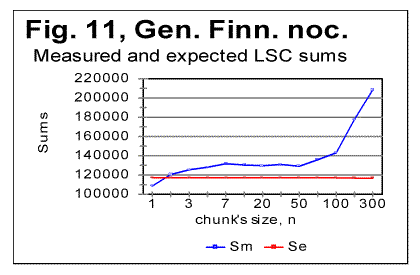
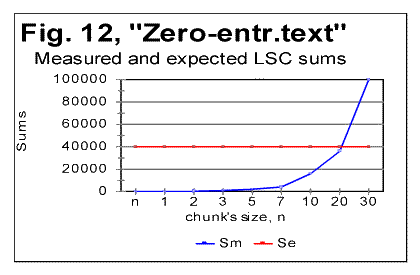
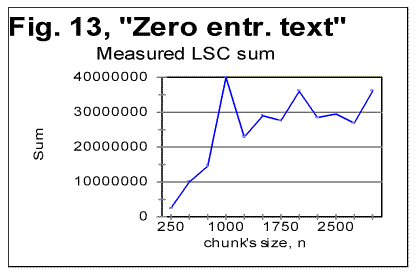
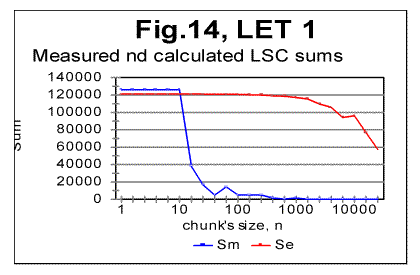
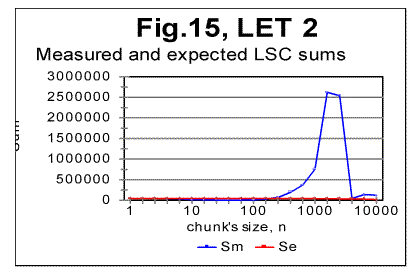
"abnormal" behavior is observed, while at As it can be seen from the above graphs, the all-letters version of the Italian text (Fig. 6) behaves in the "normal" way, displaying the Downcross Point between n=1 and n=2, as also many other texts do. It also has a distinctive Primary Minimum Point between n=50 and n=70, which is also within the range found for other all-letters texts. Likewise, the LSC sum's curve for the no-consonants version (Fig. 7) i.e. for such remnants of the original text, which contained only vowels, again had the shape with a clear Downcross Point between n=1 and n=2, and a clear Primary Minimum Point at n=10 (and a secondary minimum at n=3) which is not different in principle from the curves observed for other no-consonants texts. However, the LSC for the no-vowels Italian text of Genesis displayed a behavior quite different from the "normal" behavior of other no-vowels texts. The peculiarities observed in Fig 6 are as follows. 1) While at n=1 the "normal" measured LSC sum, Sm is always larger than the expected LSC sum Se , in the no-vowels Italian version the opposite situation exists, namely Se (1)>Sm(1). Instead of the "normal" Downcross Point somewhere between n=1 and n=3, in this version an early upcross point is observed between n=1 and n=2. The effect of this "abnormal" run of the LSC sum's curve is felt up to about n=30, where a very shallow minimum point is observed, whereas at n>30 the LSC sum's curve acquires the regular shape, typical of other texts. To verify that the observed "abnormal" behavior was not a result of some experimental error, or of some very specific feature of the particular text, but rather a feature of the Italian language, a LSC test was conducted on one more no-vowels text in Italian. This was the Italian translation of the Book of Isaiah. The result of that test is shown in Fig. 8. The similarity of curves in Figs. 6 and 8 testifies that the "abnormal" behavior of Italian no-vowels texts is not an experimental error, and that it indeed manifests some peculiarity of Italian language rather than of a specific text. Since the "abnormal" behavior in Italian texts is evident only for the non-vowels versions , i.e. for the texts containing only consonants, while both all-letters and no-consonants versions behave in a regular way, the source of the "abnormal" behavior must be connected to the pecularities of the consonants distribution in Italian language. Indeed, Italian language is distinctive in that it has a more frequent occurrence of pairs of identical consonants, "twins," such as, for example, cc, kk, ll, or tt, than other languages tested so far. At n=1 the frequency of occurrence of "twins" (what we called [1] P-factor) plays the dominant role for the value of the LSC sum. Each time any two neighboring chunks of size n=1 contain the same letter, this pair of chunks contributes zero to the LSC sum. The more often such "twins" occur in the text, the smaller is the total LSC sum at n=1. This effect is felt, to a gradually decreasing extent, as the chunk's size n increases above n=1. In the all-letters version of the Italian texts, consonants pairs are "diluted" by the vowels, which constitute about 48% of the Italian text. In Italian, vowels occur as "twins" not more often than they do in other languages. Obviously, therefore, in the no-consonants version, letter "twins" also occur not more often than they do in other languages. Hence the all-letters and no-consonants versions of Italian texts behave in the "normal" manner. The observation of the "abnormal" behavior of the no-vowels Italian text led to the assumption that a text in a language in which "twins," both of consonants and of vowels, occur even more often than in Italian, may display the "abnormal" behavior similar to that of Italian no-vowels texts, in all three versions, namely in all-letters, no-vowels, and no-consonants versions. A good candidate seemed to be Finnish which is characterized by a high frequency of "twins," both of consonants and of vowels. To verify such suggestion, a LSC test was conducted on the Finnish translation of Genesis. The results of the tests conducted on the Finnish translation of Genesis are shown in Figs. 9-11. As expected, the total LSC sums for all three versions of that text (Figs. 9-11) behave in the "abnormal" manner. In some respect, this behavior is similar to that of Italian no-vowels text (for example, displaying an early upcross point between n=1 and n=2 instead of the "normal" Downcross Point). In some other respects the Finnish text displays a peculiar behavior, distancing it even farther from the "normal" LSC curves than the Italian no-vowels text. In particular, the LSC sum for the all-letters Finnish text (Fig. 9) has several shallow minima and maxima, and only for n>70 it acquires the shape of a "normal" LSC sum. On the curves of LSC sums for the no-vowels (Fig. 10) and even more for the no-consonants Finnish texts (Fig. 11) , the "normal" minimum point disappears completely. At n>70 the total LSC sum for all three versions of the Finnish text behaves in the "normal" manner, typical of other languages. A discussion of the data shown in Figs 9-11 will be suggested in Part 2 of this paper. 5. LSC effect in artificially created low-entropy textTo find out the shape of the LSC curves for texts with very low entropies, three artificial meaningless texts were created all of which possessed a very low entropy. One such text (referred to from now on as "Zero Entropy Text" or ZET) was as follows. I chose the total length of ZET to be L=21000 letters. The text consisted of 21 segments, all of the same size m=1000 letters. Each segment contained only one letter token. For example, segment A contained only letter A, repeated 1000 times, segment B likewise contained only letter B repeated 1000 times, etc. This text is characterized by a very high degree of order and therefore by a very low entropy, both the 1st order and the higher order entropies. Indeed, at any location within a given segment there is a certainty as to which letter will be found in the next position, as well as in the next to next position, etc. Since there are 20 boundaries between the segments, where a replacement of letter tokens occurs, the entropy of ZET is not exactly zero, but it is very small and therefore, for simplification, we refer to that text as "Zero-Entropy Text" rather than "Nearly-Zero-Entropy Text." The second artificial text was created by repeatedly printing the 26-letter long English alphabet 2422 times, so that the total length of that text was 62972 letters. The entropy of that text (referred to from now on as LET-1) was obviously larger than for the ZET, but still very low, as this text also possessed a high degree of order. The third low-entropy artificial text (referred to from now on as LET-2) was constructed in the following way: the first half of the English alphabet, namely letters abcdefghkjklm were printed repeatedly seventeen times, then, immediately concatenated to the last letter, m of segment #17, the shifted set of letters (bcdefghijklmn) was repeatedly printed seventeen times, then a set that was shifted once again (cdefghjklmno) was printed seventeen times, etc, so that the total length of that text was 21200 letters. The entropy of LET-2 was a little higher than for LET-1, but still much lower than for any meaningful text, not to mention any randomized texts. For ZET, the values of the measured sum Sm vary over a range of seven orders of magnitude. Moreover, the expected sum Se (calculated for a randomized text which is the opposite of the low-entropy texts) differs from the sum Sm measured for the ZET, sometimes also by orders of magnitude. For example, at n=1, the expected sum for ZET is Se(1)=40000, whereas the measured sum is Sm(1)=40. This makes it impractical to plot the curves for Sm and Se in ZET on the same graph for the entire range of chunk's size n. Therefore I show the LSC curves only for certain parts of the range of n. In Fig. 12, the measured and expected sums are shown only for the relatively small values of n, for which the "abnormal" behavior of Finnish and no-vowels Italian texts was observed. Furthermore, in this graph only those values of sums are represented which correspond to m being divisible by n, where m is the size of a segment (in this case m=1000). If the LSC sums Sm are measured for such values of n, that m is not divisible by n (if m>n) or n is not divisible by m (if n>m) the Sm vs n curve becomes more compex in shape, as the values of Sm between the points represented in Fig. 12, deviate from the smoothly ascending (at m>n) or descending (at m<n) curve (Fig. 13). Since the structure of ZET is precisely known, it is possible to precisely calculate the LSC sum for that text. Such calculation has been performed and reported in the Appendix to Part 2 of this paper. Now, going back to Fig. 12, we see that in ZET, at n=1 the measured sum Sm is much lower than the expected sum Se (calculated for a randomized text), but, as n increases, the measured sum grows very fast and becomes larger than the expected sum (in this particular ZET it happens at about n=20). Since this experimental result also follows from the theoretically derived calculation, it requires no hypothesis to understand its nature. It is sufficient to follow the derivation in the Appendix to part 2 of this paper to fully clarify the behavior of that LSC sum. Now look at the LSC data for LET-1 and LET-2, shown in Figs. 14 and 15.
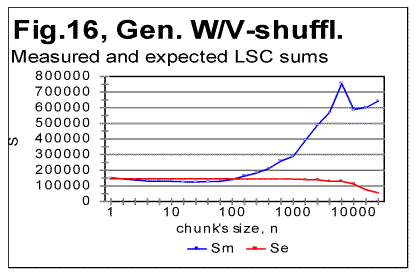
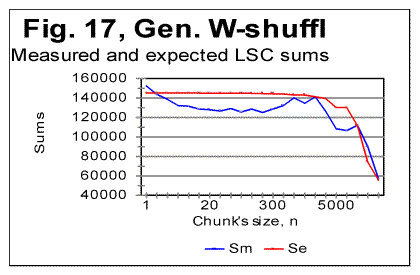
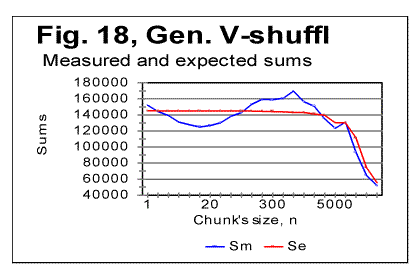
It is evident that the LSC sums behave very differently for the three above low-entropy texts. The discussion of the described behavior of low-entropy texts will be suggested in Part 2 of this paper. Comment. Texts LET-1 and LET-2 were prepared by Dr. McKay while I did not know the structure of these two texts, and then he mailed to me the tables of LSC sums for those texts without revealing their structure. My task was to guess the structure of these two texts from the data for LSC sums. This enabled us to test if indeed viewing the LSC sums can provide enough clues to successfully guess the structure of the text. The test was rather successful since for LET-1, I had completely figured out its structure (namely that it was an alphabet of 26 letters repeated 2422 times) in about 1 hour. As to LET-2 whose structure was much more complicated, I had, in about half-hour, successfully determined that it was a sequence of concatenated alphabets, with gradually shifting beginning letter. If I had spent some more time doing some arithmetic, I would probably figure out also the size of the alphabet and the number of shifted letters (which in this case was 1 after 17 repetitions). 6. LSC effect in texts randomized in different ways.To test texts which may occupy positions above that of Hebrew on the entropy ranks scale, several methods of randomization of the text of Genesis in Hebrew were used, which differed from random permutations of the letters of the original meaningful text (the latter was done in [1]). In the following presentation of the data obtained for the versions of randomization employed, the notations are as follows: "W/V-shuffled" are texts obtained by permuting words within the verses of Genesis in Hebrew, without permuting verses themselves. "W-shuffled" are texts randomized by permuting words all over the Hebrew text of Genesis, but not permuting letters within words. Finally, "V-shuffled" were texts obtained by permuting verses all over the Hebrew original of Genesis, without permuting either words or letters within the verses. The results are shown in Figs. 16-18. In Table 4, some characteristic quantities are gathered for the three randomized versions of Genesis in Hebrew, as well as for its original meaningful text. Table 4. Downcross Points (DCP), Primary Minimum Points (PMP) and Upcross Points (UCP), in the text of Genesis in Hebrew permuted in different ways.
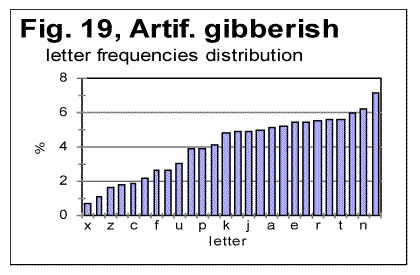
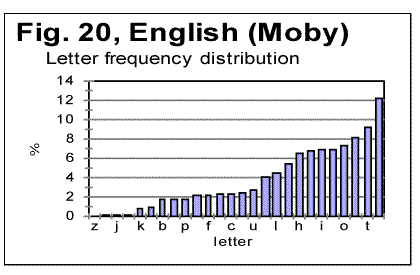
Permuting words all over the text, without permuting letters within the words (Fig. 17) practically destroys the LSC curve's character which would be typical of meaningful texts. As it could be expected, for small chunks, when n is less than the average length of a word, the curve preserves some features typical of meaningful texts (for example, on curve in Fig. 24, the Downcross Point can be seen at n between 2 and 3). However, instead of a well formed minimum point, as the one typically observed for meaningful texts, the curve for the word-shuffled text displays a rather diffuse, flattened minimum, accompanied by a number of secondary flat minima. At larger n, the curve for the word-shuffled text displays the behavior rather typical of randomized text [1]. From Fig. 18 it can be seen that for verses-shuffled text, also at small n, when the chunk's size is less than that of an average verse, the LSC curve preserves some features of the curve for the original meaningful text, including the Downcross Point, the Minimum Point, and the Upcross Point. However, at larger n the curve becomes quite different from those for meaningful texts, and behaves similarly to curves for letter-randomized texts [1, part 2]. As to the W/V shuffled version, when words are permuted within verses, without shuffling the verses themselves, the LSC curve largely preserves the features of that for the meaningful original. The discussion of the above data will be suggested in Part 2 of this paper. 7. LSC in artificially created gibberishTo further explore the shape of LSC curves in various types of texts, and to compare them to meaningful texts, I created artificially a text, about 10000 letters long, whose structure I attempted to make as random as possible. It is known that humans are incapable of creating a genuinely random text without using special means, as, for example, a computer-based generator of random numbers. I strived nevertheless to make up a text which would be maximally random. To this end, I simply hit the keys on a computer keyboard, trying to avoid favoring any keys at the expense of any other keys. In other words, I hit the keys chaotically, with certain exceptions, as follows. Throughout the text, I repeated a few identical groups of letters (such a daiinhmt, ee, etc). Additionally, from time to time, I repeated locally, two or three times, some letter groups by copying them from preceding lines. The reason for such deviation from a fully chaotic choice of keys was that I wanted to imitate to some extent the text of Voynich manuscript, as a part of a test of that manuscript, as described in detail elsewhere [2]. The repeated letter groups constituted a very small percentage of the text, which therefore was expected to be highly random in its letter composition. (The text in question can be viewed at http://www.talkreason.org/articles/artgib.cfm. The text that is randomized to a considerable extent, is expected to have two distinctive features. First, the highly randomized text should contain about the same percent of vowels as the alphabet has. For example, in regular meaningful English texts vowels constitute close to 38% of letters. On the other hand, the percentage of vowels (a,e,i,o,u, and y) in the English alphabet is 23%. Therefore a random text composed of the letters of English alphabet is expected to also have close to 23% of vowels rather than close to 38% . In the artificial gibberish I created, the percentage of vowels was found to be about 25%. This indicates that my artificial gibberish was indeed a text randomized to a considerable extent compared to regular meaningful English texts. Second, a random text is expected to have a rather uniform distribution of all letters frequencies. Let us look at the histograms for letter frequency distributions, one for my artificial gibberish in Fig. 19, and the other for a regular meaninful English text (in this example - for Moby Dick) in Fig. 20. Viewing the two histograms leads to the following conclusions. First, the letter frequency distribution in my artificial gibberish is not as uniform as one would naively expect it to be for an imitation of a perfectly random text. Despite my effort to create a random text I inadvertently somehow favored certain keys on the keyboard at the expense of some other keys. The frequencies of letters in the two texts are however rather different, as it could be expected. For example, in regular meaningful English texts the most frequent letter is e. In my artificial gibberish the frequency of letter e is below that frequency for seven other letters. Finally, what is of interest for us, the histogram for the artificial gibberish, at a glance, is considerably more uniform than it is for the regular meaningful text. The LSC sums for the artificial gibberish will be shown in Part 2 (http://www.talkreason.org/articles/addlang2.cfm) where also the discussion of all experimental data will be presented, as well as the list of references and the calculation of LSC sums for the "Zero-entropy text" (ZET). Originally posted to Mark Perakh's website on July 2, 1999. |

